What's it about?
The blistering pace of recent technological advances has led lens designers to rely increasingly on freeform optical components as crucial pieces of their designs. As these freeform components increase in geometrical complexity and continue to deviate further from traditional optical designs, the optical manufacturing community must rethink their fabrication processes in order to keep pace. To meet these new demands, Optimax has developed a variety of new deterministic freeform manufacturing processes. Combining traditional optical fabrication techniques with cutting edge technological innovations has yielded a multifaceted manufacturing approach that can successfully handle even the most extreme freeform optical surfaces.
In particular, Optimax has placed emphasis on refining the deterministic form correction process. By developing many of these procedures in house, changes can be implemented quickly and efficiently in order to rapidly converge on an optimal manufacturing method. Advances in metrology techniques allow for rapid identification and quantification of irregularities in freeform surfaces, while deterministic correction algorithms precisely target features on the part and drastically reduce overall correction time. Together, these improvements have yielded significant advances in the realm of freeform manufacturing. With further refinements to these and other aspects of the freeform manufacturing process, the production of increasingly radical freeform optical components is quickly becoming a reality.
1. INTRODUCTION
In order to deterministically correct form in a surface, it is imperative to have an accurate representation of error in the surface. When working with freeform surfaces, especially those with steep local curvatures such as the corrector arch shown below in Figure 1, one must always be aware of possible distortion in the measurements. Distortion is a stretching or misrepresentation of surface deviation data brought about by a projection of the surface onto a 2D plane. This distortion is similar, but not mathematically equivalent to optical distortion (barrel or pincushion). Many times, this phenomenon results in either incorrect placement of error features on the optical surface or incorrect measurements of the magnitude of those errors.
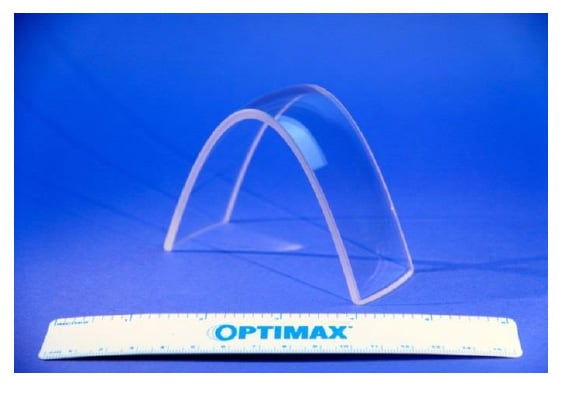
Figure 1 Completed freeform corrector arch. The steep sides of the arch presented a unique challenge when
analyzing surface data of the part.
2. EXPERIMENTAL SETUP AND RESULTS
Procedure
To better understand these distortion errors, we performed an experiment using a corrector arch currently being manufactured at the time. Due to the steep sidewalls of the arch, measurements of the surface are especially prone to distortion effects and therefore an excellent candidate for this study. To begin, tape strips of a constant lateral thickness were evenly spaced within 0.5 mm over the convex surface of the arch, as seen in Figure 2 . Using a scanning touch probe coordinate measurement machine (CMM) as our measurement device, we then scanned the surface of the part. Since the height of the tape is significantly greater than the irregularity in the surface, we can clearly distinguish the strips on the deviation map seen in Figure 3. The measured deviation is the difference between the measured shape and the nominal shape, normal to the surface.
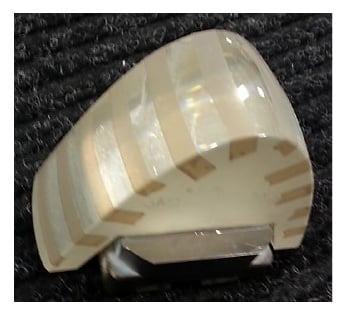
Figure 2 Picture of the tape on the part. The strips of tape are all the same width and equally spaced to within 0.5 mm along the surface with respect to arc length of the convex arch surface.
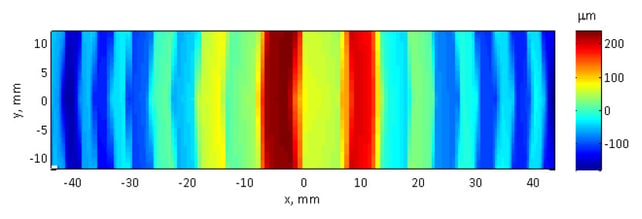
Figure 3 Raw data from CMM measurement of convex surface of corrector arch. Due to their height relative to
the surface features on the part, the tape strips are clearly visible in the measurement.
Data Analysis
A quick review of the data clearly shows that there is a lack of consistency in the measured tape widths and the distances between the tape pieces. Figure 4 displays the measured thickness of each tape strip relative to its position along the x axis. Though actually all the same width, the measurement shows that tape strips near the ends of the arch are approximately half the width of those near the apex. While this is an accurate representation of the surface as it appears projected onto the XY plane, it has its shortcomings when used to quantify features on the optical surface. Someone looking at this information would not be able to quickly identify and approximate the size of a feature unless it was located directly at the apex. Likewise, this sort of projection of the error creates complications for many CNC software packages.
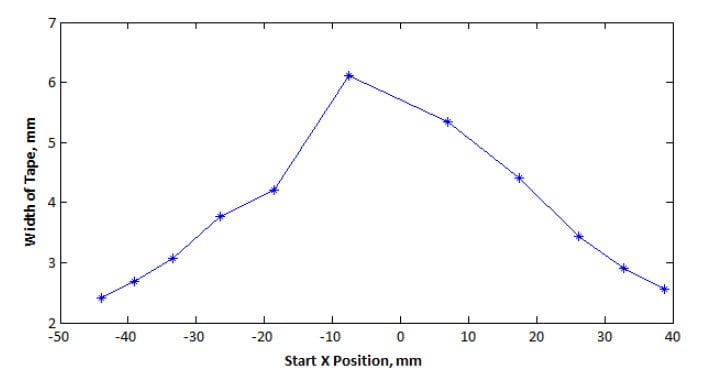
Figure 4 Width of tape when measured on the CMM. The distortion in the measurement causes the equallysized tape strips to appear much thicker at the apex and thinner at the edges of the arch.
Distortion Correction
To resolve these issues, we went about creating a way to mathematically correct the distortion in the data. In essence, our goal was to display an “unwrapped” version of the data on a more representative scale rather than a straight 2D projection described above. To begin, we examined the raw data obtained from the CMM previously presented in Figure 3. As shown in Figure 5, the data points are not evenly spaced with respect to the x axis when plotted on the XY plane. This is due to the sampling procedure of the CMM, which takes samples at equal intervals with respect to the distance it travels along the optical surface. As further explained in Figure 6, the steep geometry of the corrector arch causes the x component of each point-to-point translation to change based on its position along the profile of the arch. A simple projection of the data onto a 2D plane does not effectively communicate this phenomenon, thereby creating the aforementioned distortion effect.
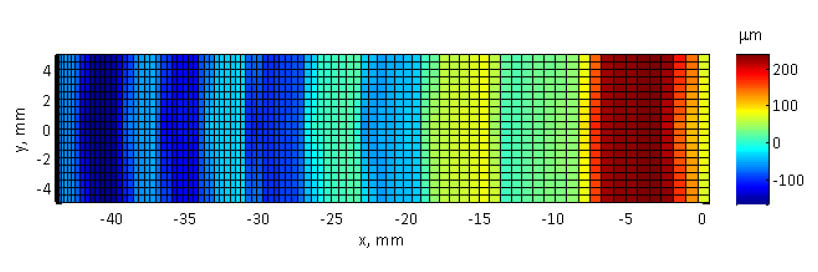
Figure 5 A subset of the raw CMM data from one edge of the arch to the apex plotted on XY axes. The data was sampled at a constant interval with respect to distance along the optical surface, which creates the point spacing gradient seen above when projected onto a 2D plane.
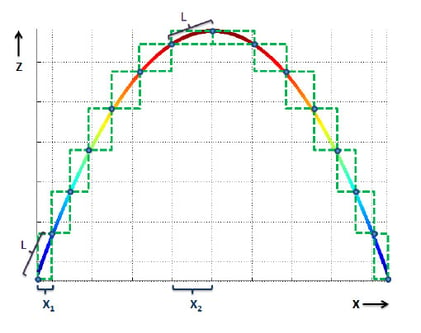
Figure 6 Representation of the CMM sampling process along the profile of the arch. The blue dots represent the locations of the measured points, while the green dashed lines show the x and z components of the translation between each point. The diagonal of each rectangle, L, is the same length, designating equal point spacing with respect to arc length. Though L remains constant, the x component of each rectangle, X1 and X2, changes in relation to its position along the profile of the arch. The difference between X1 and X2 accounts for the unequal point spacing observed in the XY projection.
In order to solve the distortion problem, we needed a way to plot these points on an evenly spaced grid in the same manner as they were sampled in. To do so, we used a basic Pythagorean distance approximation as described in Figure 7 to calculate the total length of the surface in the x direction. Dividing the number of points in the measured data set into this length then gave us the necessary spacing required to plot the data on a meaningful, even scale, as shown in Figure 8.
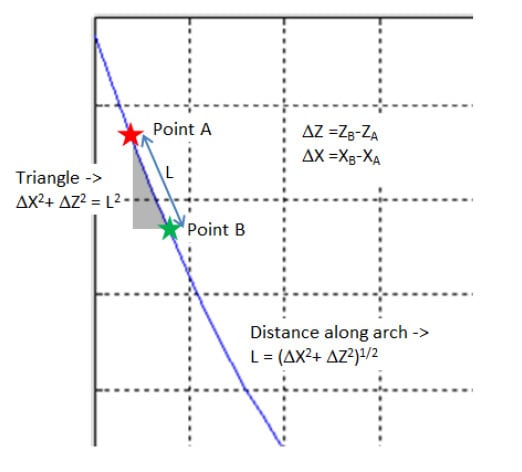
Figure 7 Representation of approach used to calculate length of optical surface. For a given section of the surface profile between points A and B, the length L is approximated through the use of the Pythagorean Theorem as shown. By summing the length of all subsections, the total length of the surface profile is found.
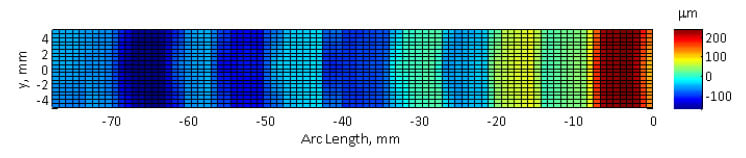
Figure 8 Surface data from CMM plotted on evenly spaced x scale. The x scale now represents the distance from the apex of the arch as measured along the surface of the part.
Results
Comparing the original XY projection to the newly unwrapped dataset reveals the significant effect distortion can have on the visualization of surface deviation data. As shown in Figure 9, unwrapping the data significantly changes how features on the surface are interpretted relative to one another.
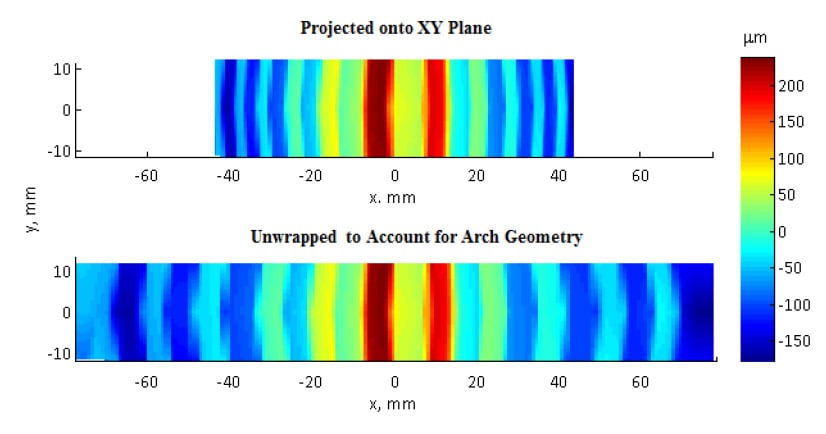
Figure 9 Results of the tape test. The top shows the raw measured data, while the bottom has been unwrapped to account for the distortion in the measurements. Though they are both plotted against the same x scale, the upper scale represents distance from the apex in the x direction while the lower scale represents distance from the apex along the convex surface of the arch.
3. CONCLUSION
When visualizing an extreme freeform surface, especially one with significant curvature or other prominent features, one must always account for distortion in order to correctly extract meaning from the data. Without proper context, the projected data appears to be an otherwise valid deviation map and could potentially be misinterpretted in a variety of ways. By looking at the data in a manner representative of unwrapping the optical surface onto a single plane, relationships between surface features are much easier to pick out. Through the use of this unwrapping technique, optical manufacturers have a powerful new tool to combat distortion in their measurements and further the state of freeform manufacturing.
*tlynch@optimaxsi.com; phone 585.265.1020; optimaxsi.com
Optifab 2015, edited by Julie L. Bentley, Sebastian Stoebenau, Proc. of SPIE Vol. 9633, 96331F © 2015 SPIE/APOMA · CCC code: 0277-786X/15/$18 · doi: 10.1117/12.2195749
Proc. of SPIE/APOMA Vol. 9633 96331F-1
Downloaded From: https://www.spiedigitallibrary.org/conference-proceedings-of-spie on 6/14/2018 Terms of Use: https://www.spiedigitallibrary.org/terms-of-use